
This blog is a part of a series, you can find links to all the blogs on this page: Writing a Debugger from Scratch
I will discuss a few questions to set the flow of the entire blog and a help you understand the why behind things.
- What do I mean by stopping the process ?
- When do we need to stop a process ?
- How do I stop the process ?
- How do I (the tracer) know that the process has stopped or an event has occurred ?
- Who should be able to stop a process ?
The first step towards writing a debugger or any tracer is to be able to stop the process that has to be
traced. Now the process can either be an already running process or one which we may spawn ourselves using the
exec() family of system calls.
What do I mean by stopping the process ?
That means we need the tracee to be interrupted in its execution (or unscheduled from the CPU). That can happen if either the scheduler naturally preempts and puts that process to sleep or the CPU encounters an exception (the CPU is forced to pause the execution of the userspace process and attend the exception). You can read in detail about exceptions here at the OSDev Wiki - Exceptions.
When do we need to stop ?
Now we know that we need exceptions to stop a process, the next question would be - when do we need to stop the process ? Well there are a certain situations where we would need the process to stop:
- C1: On demand to look at the process stack frame, registers, next instruction to be executed.
- C2: When the tracee receives a signal or makes a system call.
- C3: When the tracee process is about to execute an instruction at a particular address (also called as a
breakpointin debugger terminology). - C4: When the tracee reads/writes data to a particular memory address (also called a
watchpointin debugger terminology)
As these conditions involve memory, registers, scheduling, it is understandable that the CPU and the Kernel have to manage this together. And for a user-space process to be able to perform such requests, it needs the kernel help. So there must be a system-call to perform this.
How do I stop the process ?
Well from the CPU’s side, it provides the following support:
- Debug Registers (used for setting Hardware Breakpoints).
INT1instruction (usually used for Hardware Debugging)INT3instruction (usually used for Software Debugging). Detailed information can be found here.
Both of these methods call the Debug Exception Handler (#DB).
Debug Registers
The x86-64 AMD Manual lists a total of 7 Debug registers (DR0 - DR7). But all of these are not available
for setting breakpoints:
DR0-DR3are only available for breakpoints (4 registers).DR4-DR5should not be used by software.DR6is the status register, it contains the details of the exception occurred and the register that caused it (out of DR0-DR3).DR7is the control register, it is used to set and clear hardware breakpoints.
For details on how to set and clear these breakpoints refer to my blog on Writing a Debugger 04 - Hardware Breakpoints and Watchpoints.
These registers has a limitation of only 4 breakpoints/watchpoints at a time. This is definitely insufficient, so hence we move to
INT3.
INT3 Instruction
INT ninstructions are used to perform interrupts in the CPU. Out of theseINT1andINT3are used to raise Breakpoint Exceptions.INT3triggers the Breakpoint Exception (#BP). This helps use to differentiate if a Software Breakpoint was hit or the Hardware Breakpoint without checking theDR6(status) debug register.- Another great thing about this instruction is that it is only 1 byte wide. So the tracer does not need to keep track of the next instruction width when removing the breakpoint, it just needs to remove 1 byte and replace one byte of old instruction.
If it was a multi-byte instruction then it would have overwritten the next instruction and the CPU would be running garbage.
ptrace(PTRACE_ATTACH, pid, NULL, 0):
// let's say we need software bp at address 0xaddress that has the value 0xvalue
old_val = read_address(0xaddress);
// here we remove the last byte [little endian] and replace it with INT3 (0xcc)
new_val = (old_val & 0xff) | 0xcc;
set_value(0xaddress, new_val); // set/get these will be discussed in next blog

/* --- breakpoint happens --- */

// At this point the RIP reg points to the address _after_ the breakpoint
// so we need to reset the RIP so that it can restart the Breakpointed instr
regs.rip -= 1;
set_regs(regs);
// reset the old instruction otherwise it will re-trigger breakpoint again
set_value(0xaddress, old_val);

/* --- perform some work --- */

// single step when we want to resume (so that we can reinsert the breakpoint)
single_step();
// reinsert the breakpoint
set_value(0xaddress, new_val);
Now the CPU hands over the responsibility to the Debug Exception Handler registered by the Kernel. Now it’s kernel’s responsibility to pass on this to the tracer in the userspace.
Ptrace System Call
The ptrace system call and the ptrace subsystem are responsible to form the bridge between the tracer and the CPU. The ptrace system call allows a program to:
- Attach / Detach to a process -
ptrace(PTRACE_ATTACH, ...), etc. - Get / Set registers (general registers, Floating-point registers) -
ptrace(PTRACE_GETREGS, ...), etc. - Get / Set user registers such as Debug Registers -
ptrace(POKEUSER, ...), etc. - Read / Write data at memory -
ptrace(PEEKDATA, ...), etc. - Track process clone, etc. - using Signals and Ptrace stops.
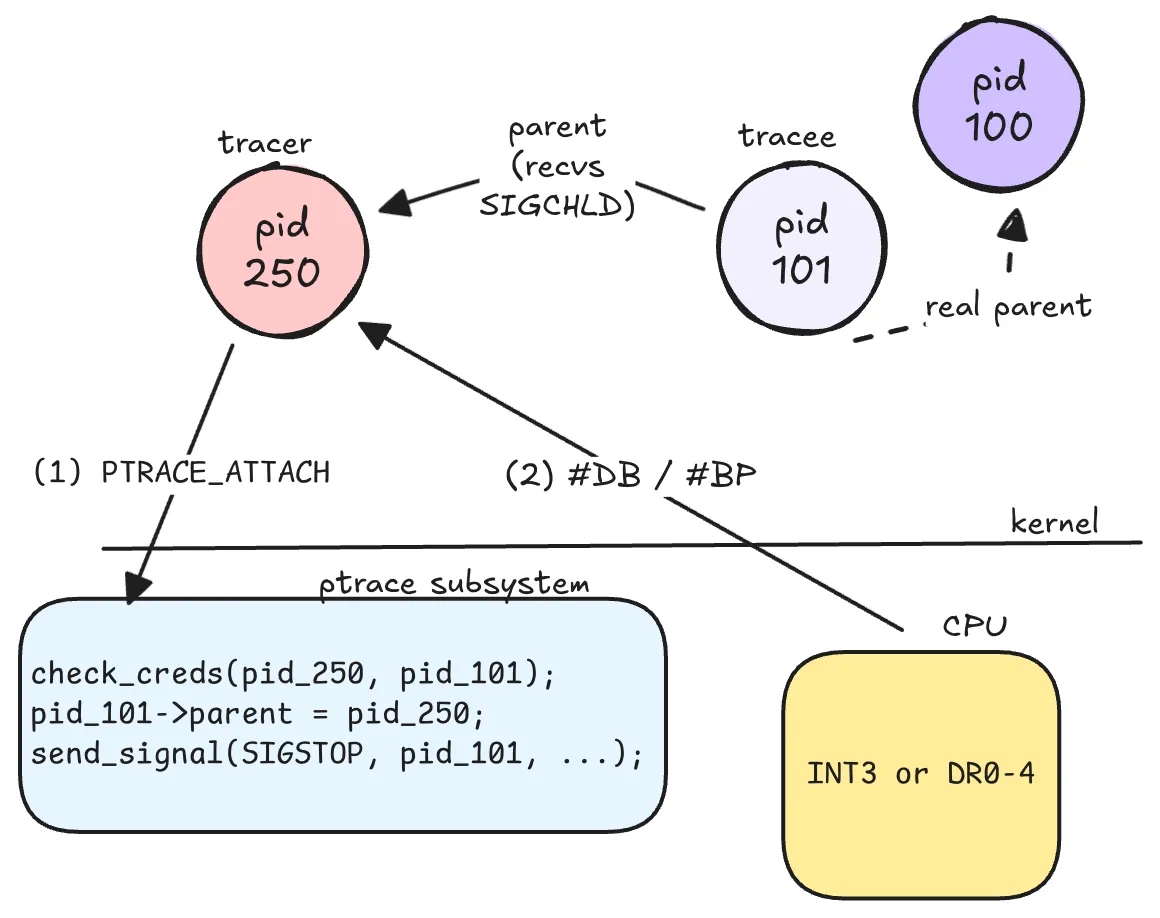
So when we perform ATTACH, the kernel stops the traced process and then notifies the tracer about it. The
tracer receives these via wait() system call. It also blocks the tracer until the tracee has an event. (Why?
: we look into this in next section - Getting notified about it).
Getting notified about it
Apart from just stopping the execution of the tracee we need to be able to get notification when the exception, a syscall or a signal delivery happens to the tracee. We also need to be able to inspect and modify register values. There are multiple ways to notify a process about an event, one of the commons ways is signals. But to be able to receive signals for a different process (i.e the tracee) we need some different mechanism for that.
But wait, it already happens, between a parent process and a child process ! The
wait() system call allows a parent to watch for state
changes in the child. So when a tracer requests to trace another process, the kernel:
- Checks for credentials (if the tracer is permitted, see next section).
- Makes the tracer the parent of the traced process.
But wait, if the Kernel makes the tracer the parent, then what happens if the tracer dies, will the traced
process become an orphan process and adopted by init process ? Wouldn’t changing the parent break
getppid() and other kernel accounting ? Well yeah, so the kernel has two pointer entries to a process
(task):
real_parentwhich points to the task that created the processparentwhich points to the task that will receiveSIGCHLDand other signals on callingwait().
So essentially the real_parent is preserved, parent is changed on calling the ptrace(PTRACE_ATTACH,...)
. For a small source code analysis, refer to Kernel Dive section. This is the reason why the
tracer must use wait() to receive traced process state change events.
Who should be able to stop ?
Should any process (even unprivileged) be allowed to stop another process and be able to inspect the memory
and registers for that process ? A Big NO! so to tackle this Linux introduced a few access modes which (or a
combination of them) are checked before allowing the tracer to stop a process. The manpage for
ptrace() lists them as (under Ptrace access mode
checking) :
… so-called “ptrace access mode” checks, whose outcome determines whether an operation is permitted … performed in cases where one process can inspect sensitive information about, or in some cases modify the state of, another process … based on … credentials and capabilities of the two processes …
PTRACE_MODE_READ- Forreadoperations or other operations that are less dangerous, such as: reading/proc/pid/auxv,/proc/pid/environ,or /proc/pid/stat, etc.PTRACE_MODE_ATTACH- Forwriteoperations, or other operations that are more dangerous, such as ptrace attaching to another process or callingprocess_vm_writev(2).
There are other creds as well which are available in the manpage.
Summary
The overall process of tracing a process is as follows:
Architecture Notes
For notes on the registers and their operations please refer to the Chapter 13 of the AMD64 Architecture Programmer’s Manual Vol 2 or to my notes at: Debug Registers.
Kernel Dive
- For
PTRACE_ATTACHandPTRACE_SEIZE, the kernel updates thetask->parentfield usingptrace_link(). This parent task receivesSIGCHLD()onwait4(). To differentiate between the real parent and the debugger, thetaskstruct also has a field calledreal_parent.
struct task_struct {
	...
	/* Real parent process: */
	struct task_struct __rcu        *real_parent;

	/* Recipient of SIGCHLD, wait4() reports: */
	struct task_struct __rcu        *parent;
	...
	/*
	* 'ptraced' is the list of tasks this task is using ptrace() on.
	*
	* This includes both natural children and PTRACE_ATTACH targets.
	* 'ptrace_entry' is this task's link on the p->parent->ptraced list.
	*/
	struct list_head                ptraced;
	struct list_head                ptrace_entry;
}

void __ptrace_link(struct task_struct *child, struct task_struct *new_parent,
		   const struct cred *ptracer_cred)
{
	BUG_ON(!list_empty(&child->ptrace_entry));
	list_add(&child->ptrace_entry, &new_parent->ptraced);
	child->parent = new_parent; // here is the parent switch
	child->ptracer_cred = get_cred(ptracer_cred);
}- It then delivers
SIGSTOPto the tracee isPTRACE_ATTACHwas used instead ofSEIZE.
static inline void ptrace_set_stopped(struct task_struct *task, bool seize)
{
  /* SEIZE doesn't trap tracee on attach */
  if (!seize)
	  send_signal_locked(SIGSTOP, SEND_SIG_PRIV, task, PIDTYPE_PID);
	...
}